A Complete Industrial Production Dashboard Solution, From Requirement to Implementation
Product knowledge 2026-03-04
Industrial production dashboards are commonly used tools for manufacturing enterprises to achieve on-site transparency and management digitization. They can centrally present and synchronously update information such as production plans, equipment status, process quality, material consumption, and personnel efficiency. A feasible production dashboard solution is not merely a simple deployment of hardware and display of software; rather, it is a systematic process covering the entire lifecycle from on-site requirement analysis, data collection, system design, deployment implementation to operation optimization. Based on the general manufacturing scenario, this article comprehensively introduces the implementation path of industrial production dashboards from the initial requirement to final implementation, providing reference ideas for enterprises’ digital transformation.
1. Preliminary Requirement Sorting and Scenario Definition
The first step in implementing the production board is to clearly define the usage goals, application scenarios and management objects, to avoid a mismatch between the functions and the actual on-site requirements.
- Define management goals
- Master the production progress and the achievement of plans
- Monitor the operating status of equipment and abnormal information
- Enhance process quality control and traceability capabilities
- Optimize material distribution and the turnover of work-in-progress
- Achieve cross-departmental and cross-position information collaboration
- Provide data support for production analysis and continuous improvement
2. Divide application scenarios and user roles
Based on the organizational structure of the enterprise and the layout of the workshop, determine the deployment location and display content of the kanban:
- Workshop master kanban: For management personnel, it shows summary data such as overall production capacity, efficiency, abnormalities, and trends
- Production line kanban: For team leaders and dispatchers, it focuses on information such as work orders, processes, cycle times, bottlenecks, etc.
- Workstation kanban: For operators, it displays job instructions, process parameters, call responses, inspection standards, etc.
- Equipment kanban: For maintenance personnel, it shows operating status, downtime, maintenance reminders, fault codes, etc.
- Review data sources and scope
Inventory the data that can be collected on-site:
- Equipment data: operation status, downtime, alarms, rotational speed, current, energy consumption, etc.
- Production data: planned output, actual output, number of qualified products, number of defective products, production cycle, etc.
- Quality data: inspection results, types of defects, distribution of defects, records of rework and repair, etc.
- Material data: material batch, inventory quantity, shortage warning, delivery status, etc.
- System data: business data interfaced with platforms such as MES, ERP, WMS, SCADA, etc.
2. Data Collection and Interface Scheme Design
The stability and accuracy of the production board depend on a standardized data collection framework.
1. Selection of Collection Methods
- Automatic collection by equipment: carried out through PLC, sensors, numerical control systems, industrial gateways, etc.
- Semi-automatic collection: confirmed manually through workstation terminals, barcode scanners, touch screens
- System integration collection: obtained from the upper-level system through APIs, databases, message queues, etc.
2. Protocol and Interface Adaptation
Based on the actual conditions of the on-site equipment and system, adopt common industrial protocols and interface methods, such as Modbus, OPC UA, TCP/IP, MQTT, HTTP, etc., to ensure that multiple sources of data can be uniformly accessed and parsed.
- Data Standardization and Cleaning
Establish a unified data dictionary to define data names, units, frequencies, and precisions. Use edge computing or platform services to complete data cleaning, deduplication, completion, and anomaly filtering to ensure the reliability of the content displayed on the dashboard.
III. Design of Kanban System Architecture and Functions
Based on requirements and data, the overall architecture and functional modules of the Kanban system are designed.
1. Overall Architecture
It is generally divided into three layers:
- Data Layer: Responsible for collecting, storing, and processing various production data
- Service Layer: Provides capabilities such as data calculation, permission management, message push, and log recording
- Presentation Layer: Presents visual interfaces through large screens, monitors, terminals, mobile devices, etc.
2. Core Function Modules
- Production Progress Board: Planned Quantity, Actual Quantity, Achievement Rate, Process Progress, Line Comparison
- Equipment Status Board: Distribution of Running/Standby/Fault, Shutdown Duration, OEE-related Indicators
- Quality Monitoring Board: Pass Rate, Defect Statistics, Defect Distribution, Quality Trend
- Material and Alarm Board: Material Shortage Call, Exception Response, Processing Progress, Closed-loop Record
- Reports and Trend Analysis: Daily Report, Weekly Report, Shift Comparison, Trend Curve, Historical Query
- Authorization and Management: Role Permissions, Menu Configuration, Data Scope, Log Audit
3. Interface Design Principles
- Clear information hierarchy, with key data highlighted
- Simple and easy-to-read interface, reducing operational complexity
- Support for multi-size screen adaptation
- Support for real-time refreshing and automatic carousel display
IV. Hardware Selection and On-site Deployment
The hardware plan should be designed based on the workshop environment, installation location, and network conditions.
1. Hardware Components
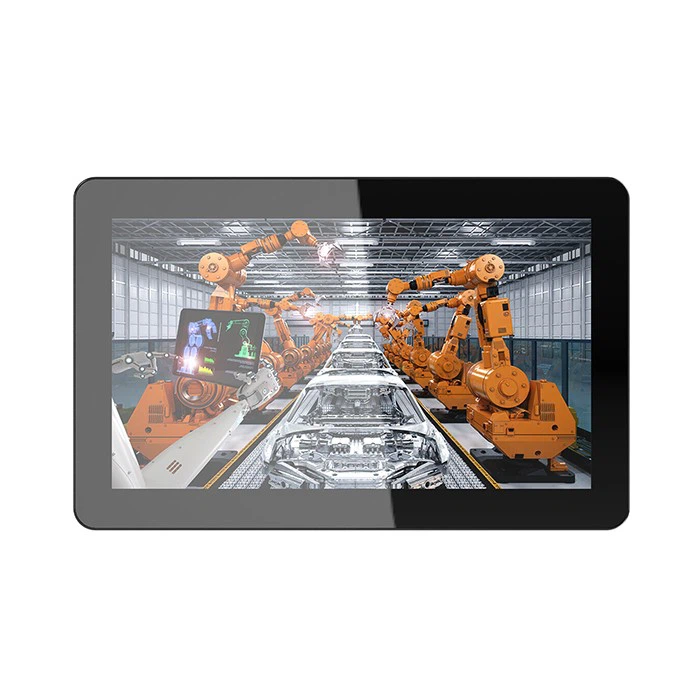
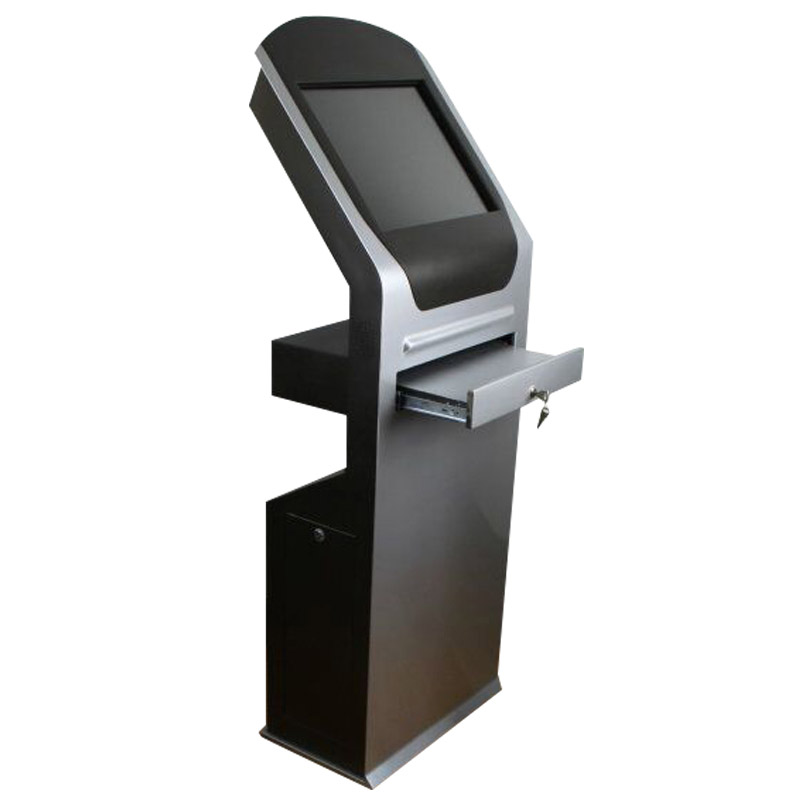
- Display Terminal: Industrial display screens, large LCD screens, wall-mounted/vertical boards, etc.
- Collection Equipment: Industrial gateways, IO modules, sensors, scanning devices, etc.
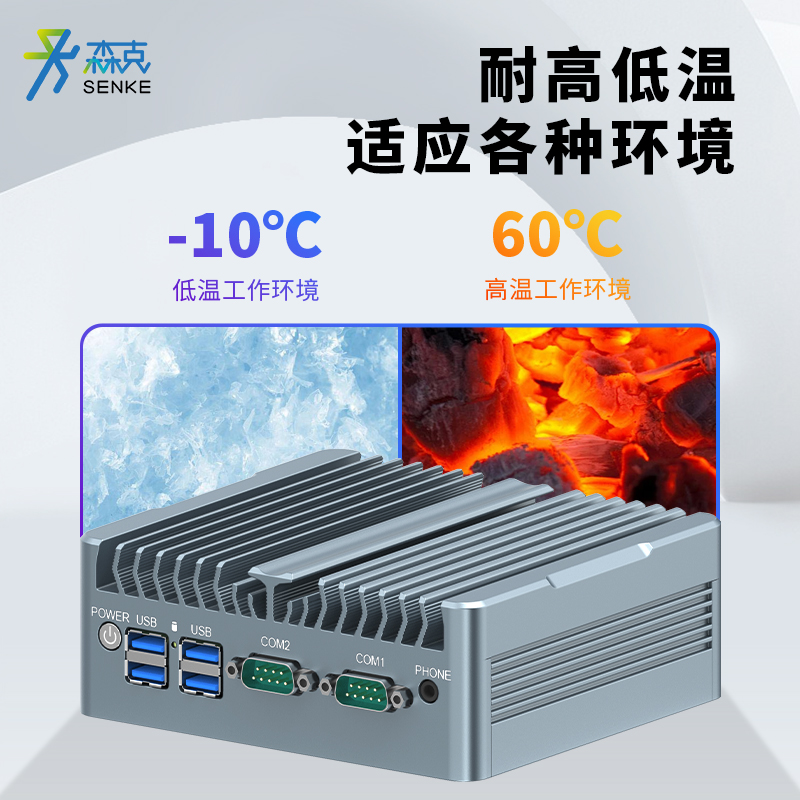
- Computing and Network: Industrial computers, switches, wireless APs, network cables, optical fibers, etc.
2. Deployment Key Points
- Plan the installation location, power supply, and network cabling in advance
- Consider dust prevention, oil resistance, and interference prevention in the industrial environment
- Conduct unified network planning to ensure stable data transmission
- Gradually implement online in different areas and production lines to minimize impact on production
V. Software Development, Integration and Testing
Before the launch of the board, development, integration, simulation operation and stress testing must be completed.
1. Development and Configuration
- Visualized development of pages and component configuration
- Data integration and interface debugging
- Configuration of alarm rules, calculation formulas, and permission policies
2. Joint Debugging and Testing
- Device Data Collection Test
- System Integration Stability Test
- Interface Refresh and Response Speed Test
- Exception Trigger and Message Push Test
- Multi-user Concurrent Access Test
- Pilot Run and Optimization
Conduct a small-scale trial run, collect feedback from team leaders, operators, and maintenance personnel, and make adjustments to the display content, refresh frequency, interface layout, and data accuracy.
VI. Online Training and Formal Implementation
After the system is stable, it will enter the stage of formal launch and promotion.
1. Operational Training
- Management: Review data, analyze issues, generate reports
- Team Leader: Monitor progress, handle anomalies, calculate efficiency
- Operator: Perform workstation operations, confirm information, call for assistance in case of abnormalities
- Maintenance Personnel: Conduct equipment inspections, perform network maintenance, troubleshoot faults
- Integration of Systems and Processes
Integrate the use of the Kanban system into daily management:
- Review the production plan and status before the shift
- Monitor anomalies during the shift and handle them promptly
- Review data and address issues after the shift
- Establish a problem response and closed-loop mechanism
VII. Post-Operation Maintenance and Continuous Optimization
Industrial production dashboards are not one-time projects; they require long-term maintenance and continuous improvement.
- Regularly check the operating status of the hardware
- Monitor the accuracy of data and the stability of data collection
- Update the display board pages and logic according to product structure and process changes
- Expand functions and data dimensions in combination with production improvement needs
- Gradually integrate deeper with MES and digital management platforms
Conclusion
A complete industrial production dashboard solution starts from the “on-site requirements”, is based on “data governance”, and aims for “stable implementation”. It covers the entire process from requirements, design, collection, development, deployment, training, and operation and maintenance. Enterprises can implement it step by step and iteratively according to their own industry characteristics, workshop scale and management level, so that the production dashboard can truly serve the transparency of the process, the improvement of efficiency and the enhancement of management, providing stable and practical on-site support for the digital transformation of the enterprise.